An essential requirement for microservices architecture is the ability to look through the request propagation between multiple microservices. If you have only few microservices, you might be able to ssh to all the servers and tail the logs. However, if you happen to have multiple servers per service, this is not something that is easy to do. The solution is to build a centralized logging system that could gather all our application logs into a single service. The logging system should meet the following requirements:
- It should work in real-time.
- It should be easy to search.
- It should help developers correlate requests between microservices.
- It should be application agnostic.
- It should place very little overhead on the application.
There are some helpful tools which can be used for building the logging system.
- Spring Cloud Sleuth - Library from Spring cloud project that provides automatic instrumentation of communication channels. It lets you track the progress of subsequent microservices by adding the appropriate headers to the HTTP requests.
- Zipkin - Zipkin is a distributed tracing system. It helps gather timing data needed to troubleshoot latency problems in microservice architectures. It manages both the collection and lookup of this data. Zipkin’s design is based on the Google Dapper paper.
- Splunk - Splunk is centralized logs analysis tool for machine generated data, unstructured/structured and complex multi-line data which provides the following features such as Easy Search/Navigate, Real-Time Visibility, Historical Analytics, Reports, Alerts, Dashboards and Visualization.
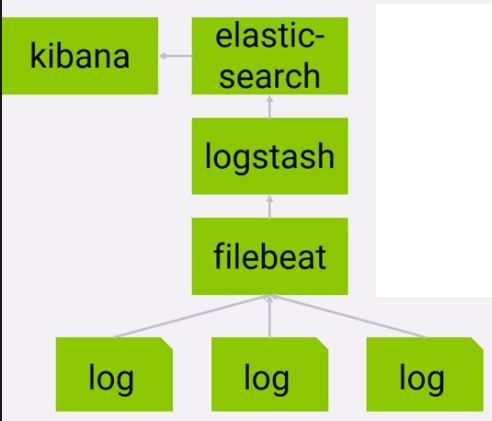
- ELK - Elasticsearch, Logstash, Kibana: three different tools usually used together. They are used for searching, analyzing, and visualizing log data in a real time.
Architecture
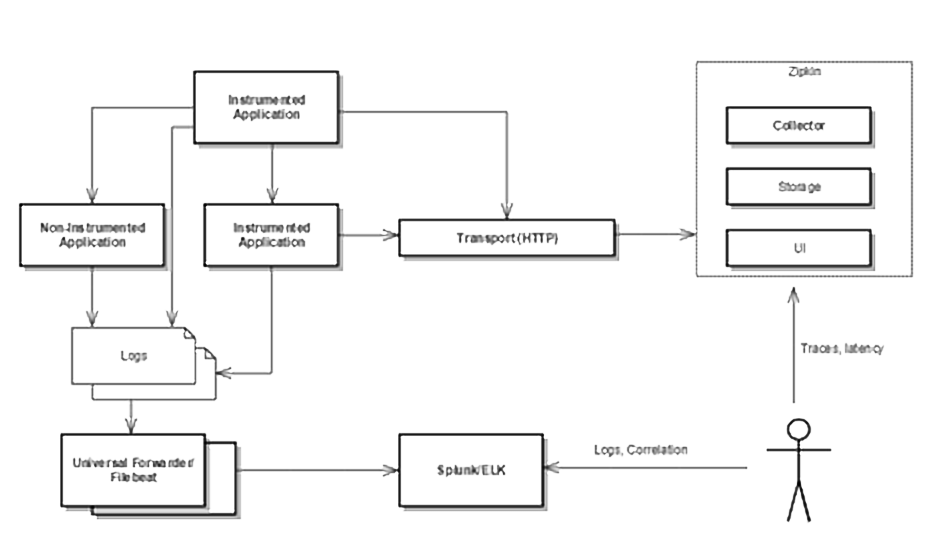
Instrument Your Application
The first step is to instrument your application so that each log statement includes traceId and spanId that will help in tracing a call as it propagates through different microservices. In the following sections, instructions are provided for instrumenting Spring Boot, NodeJS and Python applications.
Enabling Tracing for SpringBoot Applications With the Sleuth Library
1. Update the POM file to include the Sleuth Spring Boot starter library:
pom.xml
<dependencyManagement>
    <dependencies>
        <dependency>
            <groupId>org.springframework.cloud</groupId>
            <artifactId>spring-cloud-sleuth</artifactId>
            <version>1.2.2.RELEASE</version>
            <type>pom</type>
            <scope>import</scope>
        </dependency>
    </dependencies>
</dependencyManagement>
<dependency>
<groupId>org.springframework.cloud</groupId>
    <artifactId>spring-cloud-starter-sleuth</artifactId>
</dependency>
2. Update application.properties to include spring.application.name and logging.file.
application.properties
spring.application.name="Spring Boot 1"
logging.file=/var/log/logs/springboot1.log
3. Use SLF4J for logging.
Application.java
import org.slf4j.Logger;
import org.slf4j.LoggerFactory;
private static final Logger logger = LoggerFactory.getLogger(Application.class);
logger.info(quote.toString());
4. Use a RestTemplate object that is autowired by Spring. This is necessary because Spring Cloud Sleuth adds the trace id and span id via headers in the request.
Application.java
import org.springframework.web.client.RestTemplate;
@Bean
RestTemplate restTemplate() {
return new RestTemplate();
}
@Autowired
RestTemplate restTemplate;
    Quote quote = restTemplate.getForObject("http://localhost:8082/quote", Quote.class);
As an example, let's say we have a case like the following:

Now, if you run the microservices and hit the endpoint, you should see your logging statement printed in the in the log file of Microservice 1:
2017-08-21 06:09:41.925  INFO ["Spring Boot 1",945690e8fc53b5b5,945690e8fc53b5b5,false] 25841 --- [http-nio-8080-exec-10] c.b.l.controller.LoggingController       : Quote{type='success', value=Value{id=10, quote='Really loving Spring Boot, makes stand alone Spring apps easy.'}}
2017-08-21 06:29:44.244  INFO ["Spring Boot 1",b9184768fa226280,b9184768fa226280,false] 25841 --- [http-nio-8080-exec-2] c.b.l.controller.LoggingController       : Quote{type='success', value=Value{id=11, quote='I have two hours today to build an app from scratch. @springboot to the rescue!'}}
2017-08-21 06:36:13.698  INFO ["Spring Boot 1",f21c03b4f86f31a8,f21c03b4f86f31a8,false] 25841 --- [http-nio-8080-exec-4] c.b.l.controller.LoggingController       : Quote{type='success', value=Value{id=4, quote='Previous to Spring Boot, I remember XML hell, confusing set up, and many hours of frustration.'}}
and Microservice 2:
2017-08-21 06:29:44.238  INFO ["Spring Boot 2",b9184768fa226280,7a80e050a5c4aa2c,false] 25867 --- [http-nio-8082-exec-5] c.b.l.controller.LoggingController       : Quote{type='success', value=Value{id=11, quote='I have two hours today to build an app from scratch. @springboot to the rescue!'}}
2017-08-21 06:36:13.693  INFO ["Spring Boot 2",f21c03b4f86f31a8,cbeb473567ccd74a,false] 25867 --- [http-nio-8082-exec-6] c.b.l.controller.LoggingController       : Quote{type='success', value=Value{id=4, quote='Previous to Spring Boot, I remember XML hell, confusing set up, and many hours of frustration.'}}
The portion of the log statement that Sleuth adds is ["Spring Boot 1", 945690e8fc53b5b5, 945690e8fc53b5b5, false]. The first part is the application name (whatever you set spring.application.name to in application.properties). The second value is the trace id. The third value is the span id. Finally, the last value indicates whether the span should be exported to Zipkin. The trace ids are the same but the span ids are different. The trace ids are what is going to allow you to trace a request as it travels from one service to the next. The span ids are different because we have two different “units of work” occurring, one for each request.
Enabling Tracing for NodeJS Applications
The instrumentation to include traceId and spanId in logs for NodeJS and JavaScript is manual unlike in case of Spring Boot applications where these are added to each log by Spring Cloud Sleuth.
1. Instrument the NodeJS application following the steps listed here - https://github.com/openzipkin/zipkin-js-example. This project shows an example of how to use Zipkin in JavaScript.
2. Add a logger to include traceId and spanId in the logs.
logger.js
const winston = require('winston'),
  moment = require('moment');
var logger = new winston.Logger({
  transports: [
    new winston.transports.Console({
      formatter: (options) => {
        const traceId = options.meta.TraceId;
        const spanId = options.meta.SpanId;
        const service = options.meta.serviceName;
        const logLevel = options.level.toUpperCase();
        const time = moment();
        const message = options.message || '';
        return JSON.stringify({
          timestamp: time.toISOString(),
          logLevel,
          message,
          traceId,
          spanId,
          service
        });
      }
    }),
    new winston.transports.File({
      filename: 'frontend.log',
      formatter: (options) => {
        const traceId = options.meta.TraceId;
        const spanId = options.meta.SpanId;
        const service = options.meta.serviceName;
        const logLevel = options.level.toUpperCase();
        const time = moment();
        const message = options.message || '';
        return JSON.stringify({
          timestamp: time.toISOString(),
          logLevel,
          message,
          traceId,
          spanId,
          service
        });
      }
    })
  ]
});
module.exports.logger = logger;
3. Use the logger to log.
frontend.js
const {logger} = require('./logger');
app.get('/', (req, res) => {
  zipkinRest('http://localhost:9000/api')
    .then(response => {
      logger.log('info', 'Hello distributed log files!',
        { 'serviceName':'frontend', 'TraceId': req.header('X-B3-TraceId'), 'SpanId': req.header('X-B3-SpanId') });
      res.send(response.entity);
    })
    .catch(err => logger.error('Error', err.stack));
});
backend.js
const {logger} = require('./logger');
app.get('/api', (req, res) => {
  logger.log('info', 'Hello distributed log files!',
    { 'serviceName':'backend', 'TraceId': req.header('X-B3-TraceId'), 'SpanId': req.header('X-B3-SpanId') });
  res.send(new Date().toString())
});
The logfile will have traceId and spanId with the log message.
frontend.log
{"level":"info","message":"Frontend listening on port 8085!","timestamp":"2017-08-24T06:26:58.536Z"}
{"serviceName":"frontend","TraceId":"2c97a4bac4820ef8","SpanId":"2c97a4bac4820ef8","level":"info","message":"Hello distributed log files!","timestamp":"2017-08-24T06:27:02.990Z"}
{"serviceName":"backend","TraceId":"2c97a4bac4820ef8","SpanId":"7a0eff44fc42fde9","level":"info","message":"Hello distributed log files!","timestamp":"2017-08-24T06:27:02.977Z"}
Notice that the traceId is the same across two microservices.
Enabling Tracing for Python Applications
We'll be using the py_zipkin python package to instrument our Python applications. Here again, the instrumentation is manual.
1. Install py_zipkin and use the examples from https://github.com/Yelp/py_zipkin to instrument your Python application.
2. Add service_name, span_id and trace_id in your logging configuration.
logging.conf
[formatter_myFormatter]
format=%(asctime)s - %(name)s - %(levelname)s - %(service_name)s - %(trace_id)s - %(span_id)s - %(message)s
3. Trace a service call.
demo.py
from py_zipkin.zipkin import zipkin_span, create_http_headers_for_new_span
@zipkin_span(service_name='webapp', span_name='do_stuff')
def do_stuff():
    headers = create_http_headers_for_new_span()
    app.logger.info('From demo app', extra={'service_name':'demo', 'trace_id':headers['X-B3-TraceId'], 'span_id':headers['X-B3-SpanId']})
    requests.get('http://localhost:6000/service1/', headers=headers)
return 'OK'
service1.py
@app.route('/service1/')
def index():
    with zipkin_span(
        service_name='service1',
        zipkin_attrs=ZipkinAttrs(
            trace_id=request.headers['X-B3-TraceID'],
            span_id=request.headers['X-B3-SpanID'],
            parent_span_id=request.headers['X-B3-ParentSpanID'],
            flags=request.headers['X-B3-Flags'],
            is_sampled=request.headers['X-B3-Sampled'],
        ),
        span_name='index_service1',
        transport_handler=http_transport,
        port=6000,
        sample_rate=100, #0.05, # Value between 0.0 and 100.0
    ) as zipkin_context:
        headers = create_http_headers_for_new_span()
        app.logger.info('From service1 app', extra={'service_name':'service1', 'trace_id':headers['X-B3-TraceId'], 'span_id':headers['X-B3-SpanId']})
        do_stuff()
    return 'OK', 200
4. The log file will have traceId and spanId from the calls.
demo.log
2017-08-29 08:29:36,065 - __main__ - INFO - demo - 884f9f20a9172104 - 2352d7d1fadd521c - From demo app
2017-08-29 08:29:36,069 - __main__ - INFO - service1 - 884f9f20a9172104 - d7867b21585a9ba1 - From service1 app
Note that the traceId is the same across the two services.
Aggregate Logs
Once you have instrumented your application to automatically include tracing information in the logs, now let us look at Splunk and ELK for aggregating logs at a central place and correlating requests as it propagates through various services.
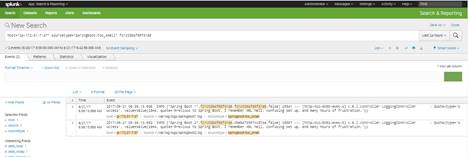
Enabling Centralized Logging Using Splunk
Splunk works on the client-server model. Splunk Forwarder is used to collect the machine-generated data from the client side and forward it to the Splunk server. We tested with the Splunk free license for a low volume of logs; it provides a maximum 500 MB of indexing per day.

1. Download and install Splunk server.
wget -O splunk-6.6.2-4b804538c686-Linux-x86_64.tgz 'https://www.splunk.com/bin/splunk/DownloadActivityServlet?architecture=x86_64&platform=linux&version=6.6.2&product=splunk&filename=splunk-6.6.2-4b804538c686-Linux-x86_64.tgz&wget=true'
sudo cp splunk-6.6.2-4b804538c686-Linux-x86_64.tgz /opt
cd /opt
sudo tar xvzf splunk-6.6.2-4b804538c686-Linux-x86_64.tgz
cd splunk
cd bin
sudo ./splunk start --accept-license
Splunk will be available at: http://
2. Enable the receiving port to get logs from Splunk Forwarder. We can do this from GUI and CLI as well. Port 9997 is the default and it can be changed.
3. Download and install Splunk Forwarder.
wget -O splunkforwarder-6.6.2-4b804538c686-Linux-x86_64.tgz 'https://www.splunk.com/bin/splunk/DownloadActivityServlet?architecture=x86_64&platform=linux&version=6.6.2&product=universalforwarder&filename=splunkforwarder-6.6.2-4b804538c686-Linux-x86_64.tgz&wget=true'
sudo cp splunkforwarder-6.6.2-4b804538c686-Linux-x86_64.tgz /opt
cd /opt
sudo tar xvzf splunkforwarder-6.6.2-4b804538c686-Linux-x86_64.tgz
cd splunkforwarder
cd bin
sudo ./splunk enable boot-start --accept-license
sudo ./splunk add forward-server <ip>:9997
sudo ./splunk list forward-server
sudo ./splunk add monitor /var/log
sudo ./splunk restart
Now login into Splunk web console and search for configured logs.
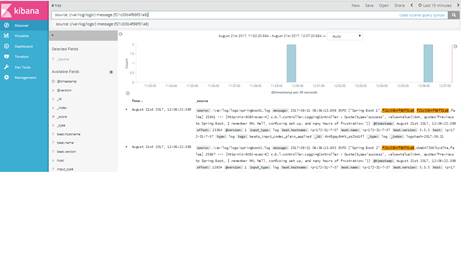
Enabling Centralized Logging Using ELK
There are three options that you have if you want Elasticsearch on AWS:
- Get an EC2, install on your own, Elastic.co has written a simple and comprehensive article on this.
- Get a third party managed Elastic search as a service, again Elastic.co is pretty good for that.
- Get the AWS Elasticsearch as a service.
We have installed ELK on our AWS. Learn how to access Kibana here.
1. To send application logs to the central Elasticsearch, follow these steps on each server.
/etc/filebeat/filebeat.yml
filebeat.prospectors:
- input_type: log
  # Paths that should be crawled and fetched. Glob based paths.
  paths:
    - /var/log/logs/*.log
    #- c:\programdata\elasticsearch\logs\*
output.logstash:
  # The Logstash hosts
  hosts: ["<ip>:5044"]
2. FileBeat sends the logs to logstash, which has been configured to send the logs to Elasticsearch. Kibana has been configured to query indices in Elasticsearch.
3. By default, Kibana does not require login credentials. Hit the url http://